Demystifying your data using Machine Learning in SQL
Machine Learning is literally changing the way businesses used to run, now-a-days It has become a standard to incorporate Machine Learning in organizations and almost all key business decisions were made with the help of these so called algorithms and it’s currently proving to be very effective when compared to the traditional methods. Insights based on existing static dashboards are no longer sufficient to make key decisions as there is a need to consider not only the past but also the future.
So, what exactly is Machine Learning and how do these algorithms consume the past to predict those magical numbers? How is it different from traditional programming?
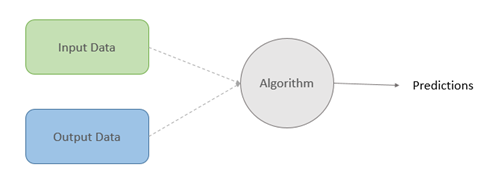 Figure 1: Machine Learning Approach
The main difference lies in the way we approach our data. In traditional programming the predictions are derived based on human made rules while in Machine Learning these rules will be replaced with the ground truth values. The algorithm tries to figure out a logic with which it can predict values close to the ground truth most of the times. Seems like a black box for you right but No. It’s not. The groundbreaking mathematical formulas invented by various great minds in the field does the trick.
So, what will be the role of a Data Scientist when an algorithm seems enough for the job? Well, it is the role of the Data Scientist to decide upon which algorithm to use depending on the nature of the data. Data Scientists have a wide range of skillsets ranging from statistics to probability to domain knowledge. The key problem over here is that there are very few of them who possess all of these skillsets. So, organizations around the world have started to reskill their existing data experts with these new skillsets but the major problem they face is that they have to learn a new programming language say Python or R to perform Machine Learning. Python has already become the go to language for Machine Learning with its huge community and contributions from top internet companies. This is where the previous generation of data experts get stuck because they used to generate great insights with the help of SQL but now, they have to learn a new language to make better use of their data.
“Why not there is a way to do Machine Learning in SQL itself?”
Well if you are one of them who used to ask this question then I have an answer for you. Oracle has come up with a product called Oracle Autonomous Data Warehouse which comes with an out-of-the-box support for Machine Learning. You can create SQL based notebooks for performing advanced analytics on your data and bring valuable insights for your organization. In this blog I will walk you through a use case in which we will be making use of data samples to identify the set of customers who are about to churn so that the organizations can take necessary steps to retain their customers. It’s always easy to retain customers than acquiring one.
Predicting Churn using Machine Learning – The SQL way
Churn Prediction is a type of classification problem in which we will be predicting the set of customers who are about to churn based on different parameters like customer demographics, usage, reviews etc.
Overview
The churn rate, also known as the rate of attrition, is most commonly known as the percentage of service subscribers who discontinue their subscriptions within a given time period. It is also the rate at which employees leave their jobs within a certain period. For a company to expand its clientele, its growth rate (measured by the number of new customers) must exceed its churn rate.
The churn rate is a particularly useful measurement in the telecommunications industry. This includes cable or satellite television providers, Internet providers, and telephone service providers (landline and wireless service providers). As most customers have multiple options from which to choose, the churn rate helps a company determine how it is measuring up to its competitors. If one out of every 20 subscribers to a high-speed Internet service terminated their subscriptions within a year, the annual churn rate for that internet provider would be 5%.
Objective
With the help of the out-of-the-box Machine Learning scripts in Oracle Autonomous Data Warehouse we can train a model based on previous churn samples to predict future churns. This will be a classification (binary classification) problem because we are trying to classify a customer whether he/she will churn or not (Yes/No) so that we can provide personalized offers accordingly.
Approach
We will be gathering the required data and start to understand it by performing some Exploratory Data Analysis. The more time you spend in understanding your data means less effort while creating and tuning the models. That’s why this is a crucial step in every Data Science project. After having a better understanding about our data, we will prepare the data for actual model creation process.
I assume that you have your instance setup and ready. Now we can start by uploading our data to a table in our Autonomous instance. You can use any method to upload your data, but I will focus on SQL Developer way.
Uploading Data
Connect to SQL Developer with the DB connection details and import the csv file into a table called customer_details.
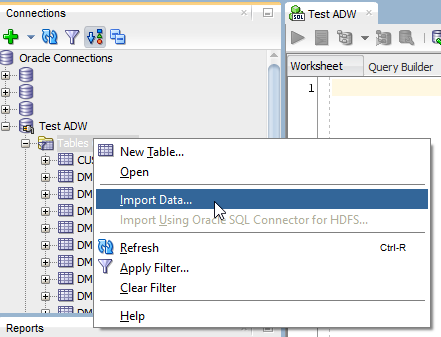
Figure 2: Importing data to ADW using SQL Developer
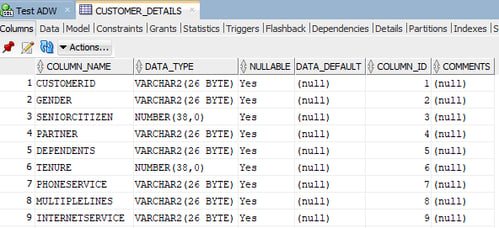 Figure 3. Overview of the imported data
Creating notebook
Login using the user with ML permissions and click on Notebooks from the home page. Click Create a Notebook and name it as Churn Classification. Now open your notebook and you are all set for diving deep into your data.
Analytics
Here we are with an interesting use case and the data ready to be analyzed. The following queries will get you the desired results.
Data Overview
It is good practice to execute this first so that you can have a glimpse about your data and the actual values stored in them. You can check that by executing the following query.
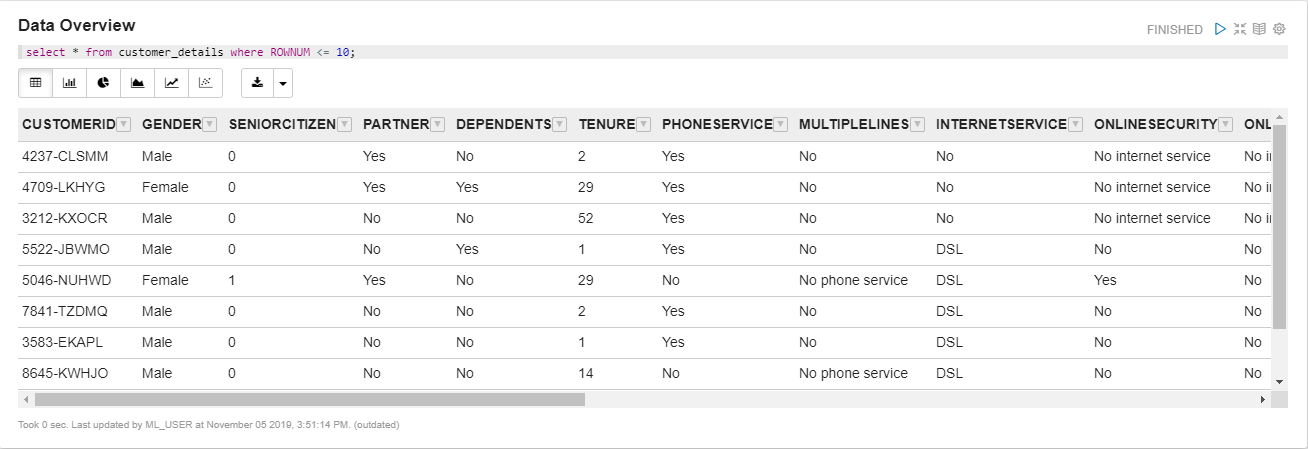
Figure 4. Typically, the top rows in your dataset
Check number of data samples
We need to have an idea of how much amount to data is available at our disposal. You can know that by firing the following query.
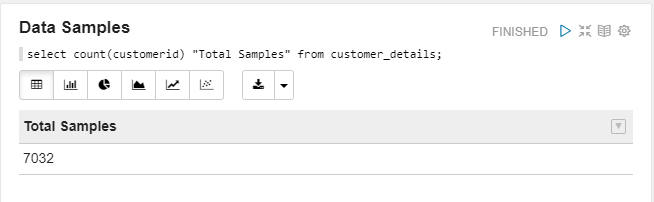
Figure 5: Number of data samples
We have 7032 data samples in our dataset. It is relatively a very small dataset when compared to the amount of data used in our actual Data Science projects, but it is enough for you to get started.
Check the target distribution
As it is a classification problem you might have already guessed that our target has different discrete classes. You are correct! In our example our target classes are “Yes” and “No”. It is crucial for us to understand how they are distributed. The reason behind that is that if we have huge imbalance in our data (uneven number of examples) then probably our model will always predict the majority class to improve the accuracy and that’s not what we want.
Note: There are different set of evaluation metrics for evaluating the performance of your model if you have data imbalance like F1 Score, Kappa etc.., but for now let us stick with Accuracy as the metric.
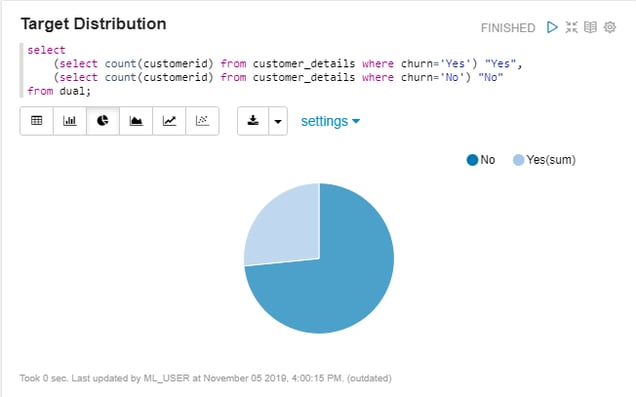
Figure 6. Distribution of the target variable
We can clearly see that there is data imbalance as we have more samples for No than Yes. We might need to use Under-sampling/Over-sampling depending on the data to solve this problem.
Performing additional analysis
It is all about creativity from now on you can perform as much analysis as you want to understand your data better. I will share some of the insights that I have tried to understand here and opening up the possibilities for you.
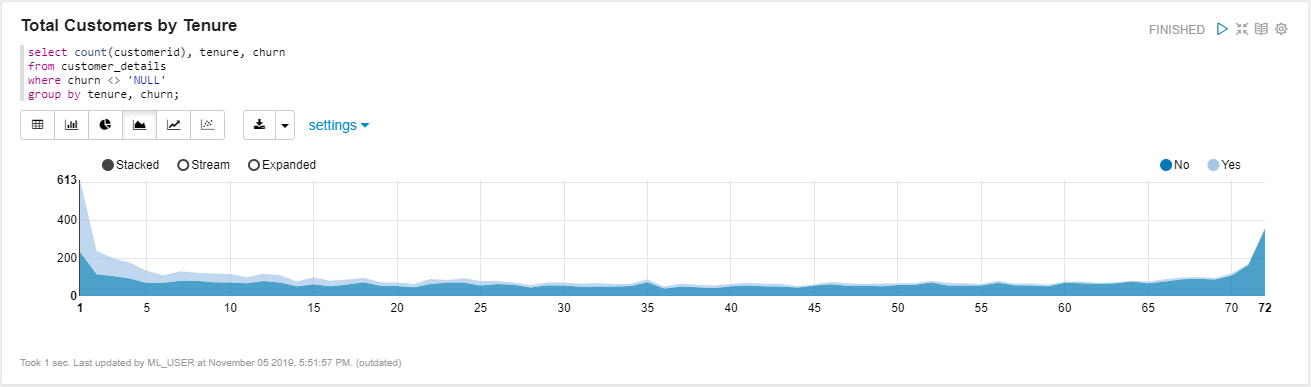 Figure 7. Total number of customers by tenure
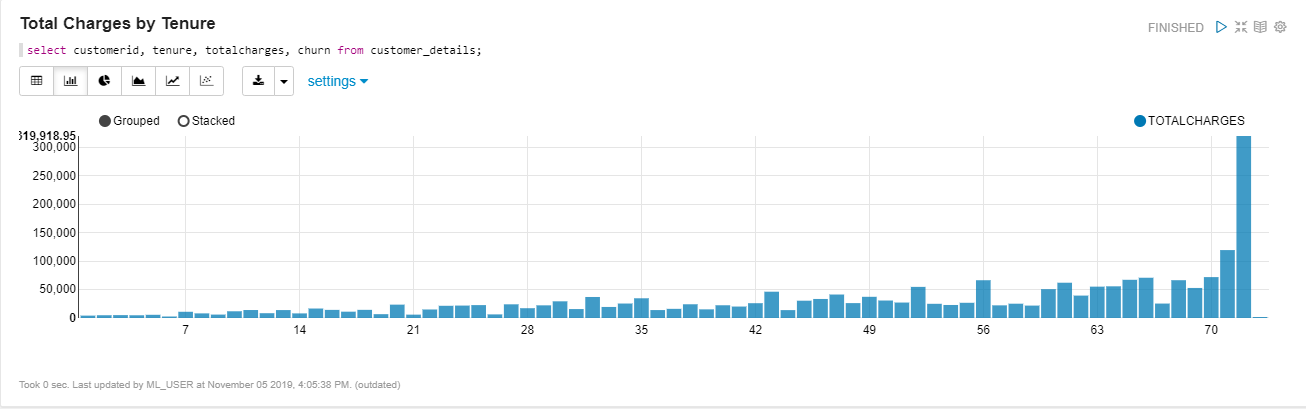
Figure 8. Total charges for customers aggregated over tenure
Preparing your data
After understanding our data, we need to prepare our data in a way that Oracle understands. It is always good to start with minimal number of features because if your model can predict correctly with that then why confuse it with additional features? Let us start by considering the following features: customerID (Oracle’s requirement), gender, tenure, monthlycharges, totalcharges and churn (Target). So, we will be creating a view with only these columns.
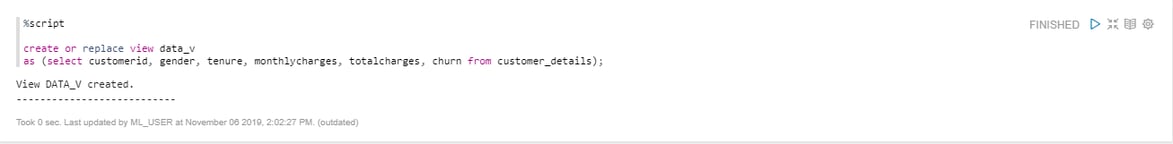
Figure 9. Creating a view
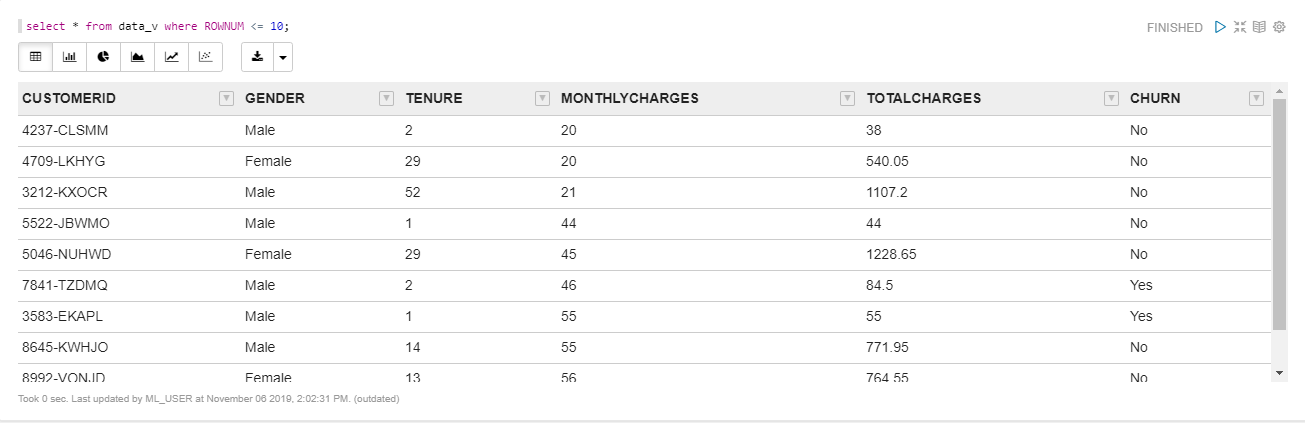
Figure 10. View overview
Split the data into Train and Test
We will be splitting our data into two: one for training the model and the other to check how well it performs on new data. We will write a PL/SQL procedure for that.
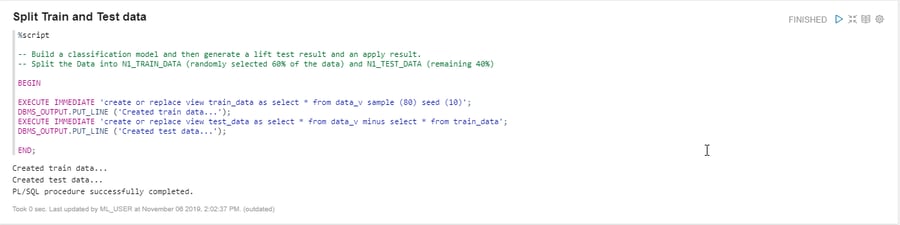
Figure 11. Splitting data into Train and Test sets
Creating a model
Finally, we can now work on our model. In our case we are creating a decision tree classifier, so we are defining it as the type of the algorithm in the model settings table. Then pass name of the model, problem type, data, index, target and settings table name to the CREATE_MODEL function.
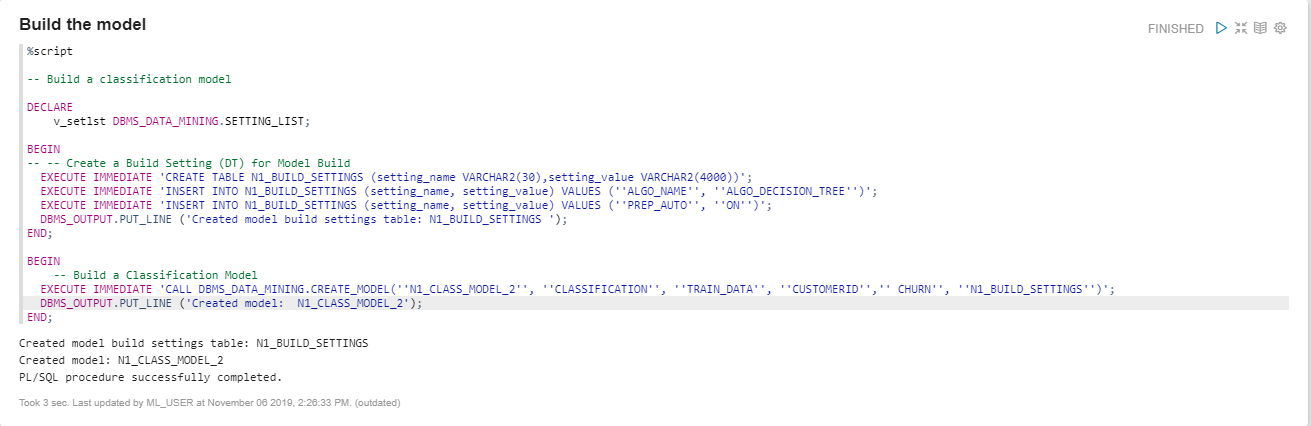
Figure 12. Building the model
Applying the model
There we go. We have our model named N1_CLASS_MODEL_2. Now we need to apply this model to our test set to check how well our model has been trained.
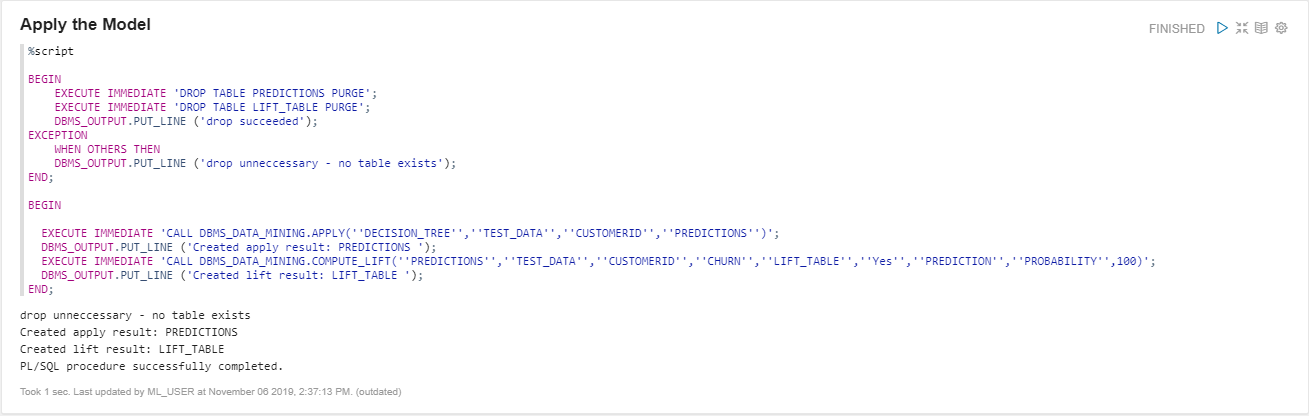
Figure 13. Applying the model
Getting insights
Here are some of the customers who are at the risk of churning.
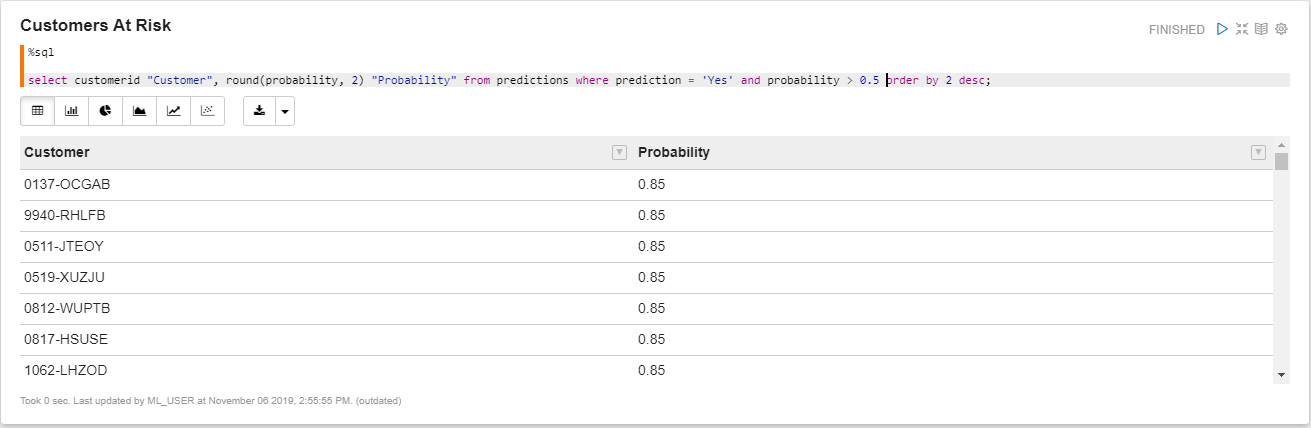
Figure 14. Customers at risk
And here is the list of customers by predicted class, probability and the actual ground truth. As you can observe our model has identified some samples incorrectly but you can always improve it by training it longer or adding more features, now I will leave the experiment part to you.
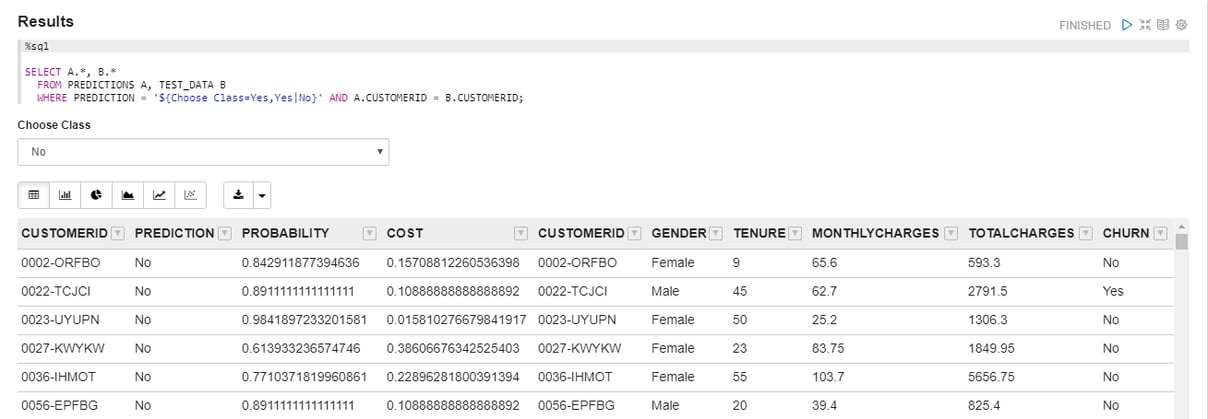
Figure 15. Result data
So far, we have investigated a sample data to understand how you can perform Machine Learning with SQL on Oracle’s Autonomous Data Warehouse. We have also delivered Machine Learning projects using other platforms and open-source libraries like AWS SageMaker and Python. If you are interested to learn more or need assistance in implementing Machine Learning for your business, feel free to reach out to us. To know more about Machine Learning and Artificial Intelligence please click the following link https://www.oneglobesystems.com/ml-ai-enabled-predictive-analytics
